Composite
charts and Davison
relationship charts…explained!

Two different ways to combine horoscopes --
one as a shoreline, the other a timespot -- look similar, yet are
worlds apart.
By John Townley, March
20014
Before the early
1970s,
the approach to chart comparisons and relationships was simply
synastry: you put one chart on top of the other and noted
where they touched or aspected each other. Then came composite charts,
constructed of mutual midpoints, which seemed to shed a new dynamic
light on the relationship between two horoscopes for reasons not
well-understood at the time.
But in the decade
following, there arose a flood of artificially-imagined spin-offs,
knock-offs, and basically arbitrary hybrids that included multiple
composites, composite progressions and directions, composite solar and
lunar returns, composites between nations, composites between people
and countries or cities, nations, and events, the composite point, time
composites, harmonic composites, coalescent charts, all confusingly
alternate ways of manipulating two charts to see how they might relate.
By the Millennium, most
of these concoctions were winnowed out until really the only
regularly-used enrichment to standard synastry is now the original
midpoint composite itself. The only close runner-up, still offered in
many software programs, is Ronald C. Davison’s time-midpoint
chart often called the Davison relationship chart, which can work
fairly well, particularly when and where it overlaps the space-midpoint
chart, which at least half of it usually does.


Two
seminal books from the 1970s, with completely different takes on
relationships and personal interaction.
But why would one
chart,
based on midpoints in space, work so much better (or differently) than
another one based in the midpoint in time? And why do they
overlap so strangely? Are they, in fact, totally different animals? It
can seem confusing, but when you get down to the physical basics of why
they are what they are, there are compelling reasons why one works and
the other may not, depending on what you’re asking of it. So
here’s a look at each one, using the ever-popular (and
well-documented) Brad Pitt (12-18-1963, 6:31 AM, Shawnee, OK) and
Angelina Jolie (6-4-1975, 9:09 AM, Los Angeles, CA) as the example duo.
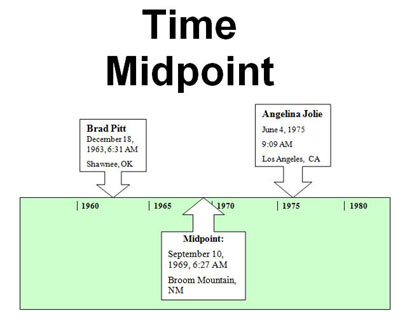
Easiest first, the
Davison chart is simply a natal chart cast for the midpoint in time and
place between them, which for Brad and Angelina would be September 10,
1969, 6:27 AM local time, on the far Northeast slope of Broom Mountain,
NM (deep in the methedrine mountains about 85 miles SW of Albuquerque).
It’s hard to find any connection with either person and the
date (the NY Mets reached #1, Jimi Hendrix performed in Greenwich
Village, a U.S. nuclear test at Grand Valley, CO), and it’s
likely neither has ever been to or even heard of Broom Mountain. And,
of course, as always with Davison charts, one of them (Jolie) was not
even born then, while the other (Pitt) was only five and living far
away in Springfield, MO, at the chart’s inception.
If there is any
connection with this
time chart and either person’s natal chart, it is out there
on the
astral plane. But that might be appropriate, as Davison was a
Theosophist, president of the Theosophical Society’s
Astrological
Lodge, London, and the Theosophical approach to astrology has been
traditionally ethereal to say the least. He rectified all his charts,
for instance, based on the obscure (to most astrologers)
“prenatal
epoch”, a theoretical chart of conception or “soul
chart” based on
backward extrapolation of the position of the birth Moon and Ascendant,
an idea traced back as far as Vettius Valens in the second century and
a favorite of the school of esoteric astrologers like Alice Bailey.
Below:
Brangelina in Space
and Time:
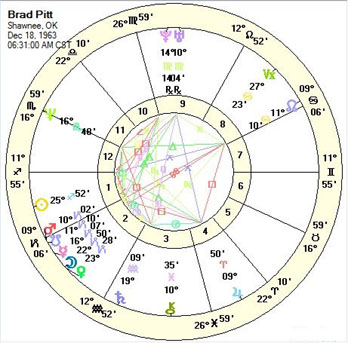
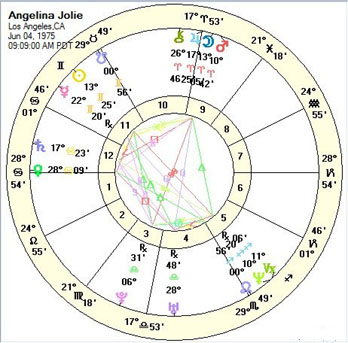
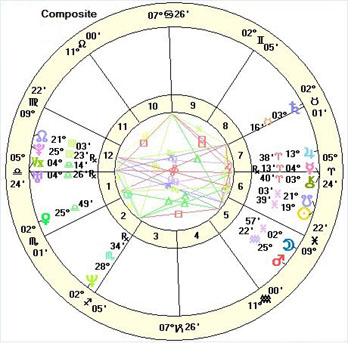
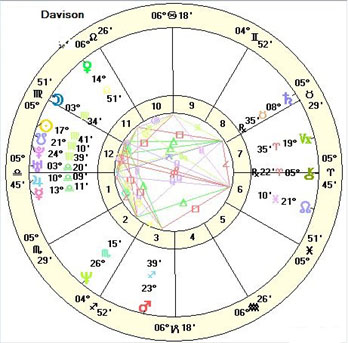
Above: In both composite and
Davison charts, Saturn and the
outer planets are usually close to the same spot, but everything else
varies
enormously, depending on how far apart the births are, how the midpoint
in time
happens to bisect the varying and retrograding planetary cycles. In
this case,
the Ascendants of both are within a degree (unusually close), Sun and
Moon are
along the same axes but opposite, Jupiter almost so, and the rest are
totally
different. Yet, as to interpretation by house and aspect, the two are
kind of
ghostlike semi-reflections of each other, as is often the case, though
one
might argue the composite more concretely depicts the Brangelina
relationship
as it has been publicly known so far, visibly and successfully partner
and
service-oriented, rather than hidden, acrimonious and
troublesome, as the
Davison chart would suggest...
Composites
use ordinary
midpoints between two charts, Davison makes a separate chart between
two times.
Some historical context:
This
timeline-base
“relationship chart” was a child of
Davison’s latter years (first presented in 1977’s Synastry: Understanding
Human Relationships Through Astrology, his life
spanning 1914-85), so it doesn’t appear to be central to his
work, but more an off-the-cuff response to the sudden burst of interest
in composite/midpoint charts in the air at the time. With all those
Germanic space-midpoint charts about, why not a nice English one using
time? That “why not?” approach was the genesis of
the many speculative charts dealing with relationships that were
spawned in the 1970s, including several of my own in my 1973 slim but
seminal introductory volume on composites (like the latitude-sensitive
composite, the composite point, the group composite, and composite
progressions, none of which turned out to actually work). In the end,
it turned out there were a lot of good reasons “why
not”, once one figured out what a composite chart really is,
and isn’t. Nevertheless, perhaps the Davison chart has
something to be said for it on the more etheric planes, but its
following has become increasingly limited, lacking a compelling raison
d’etre or track record.

 Ronald
C. Davison (l.,1914-1985), former president of the
Astrological Lodge of the Theosophical Society, London, editor of
The Astrology Magazine,
introduced time-midpoint
charts five years after John Townley (r.,1945-), former president of
the
Astrologers’ Guild of America, New York, editor of The
Astrological Review, introduced space midpoint composites.
The composite chart (of
mutual
space-midpoints), interestingly, unlike the usually obscurely-located
and timed Davison chart, isn’t an actual horoscope at all, in
the
strictest terms. Its positions coincide with no actual time and
location, but are a simple extrapolation from two charts, a
mathematical construct of mutual midpoints. So what, in fact, is it,
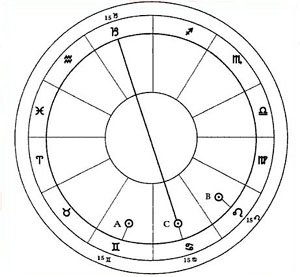
and what does it tell you? Similar to how a graph measures positions in
time and space, a composite measures where ongoing transit cycles shift
their favor and emphasis from one chart to the other. So, in our
diagram above left, if person A has Sun at 15 Gemini, each time the
transiting Sun, Moon, or any other planet passes that degree, it tends
to emphasize and strengthen (or in the case of malefics, diminish)
A’s
Sun and its qualities, like a passing spotlight. And if
person B has
Sun at 15 Leo, the same happens for B when regularly cycling transits
reach that degree. So, the near midpoint (C) at 15 Cancer is the point
where the relative varying strength of A becomes equal to B and then B
begins to be favored. Later, the process switches at the far midpoint
of 15 Capricorn. Take the midpoints of each of A’s and
B’s mutual
planets (Sun with Sun, Moon with Moon, etc.), put them into a house
wheel made up of mutual house cusp midpoints, and that’s your
composite
chart. It’s essentially a clever circular snapshot
of the timing
points of power shifts from one person to another, depicted in a
familiar horoscope wheel, packed with information about how transits
push and pull the partnership, shaping it along the
way.
Metaphorically, if you
look at A as the land and B as the sea, the composite would describe
the entire shoreline between the two, where the waves beat and the
ongoing weather is made. Some shores are smooth and gentle, easily
traversed, some rocky and troublesome, inviting shipwreck.

The space-midpoint
composite chart serves as a dynamic shoreline where two charts
continually interact, share transits.
This approach has
the
same
historical and physical basis as ordinary midpoints in a natal chart.
Although widespread midpoint-usage (and the early conception of
composites as well) didn’t flower until the 1920s, the
founding
concepts of besiegement and translation of light go back to ancient
times as tried and true elements of the horoscope. Composites are just
a way of applying that same idea to two persons in the same vicinity,
instead of two planets in the same nativity.
Interestingly, how and
why midpoints of any sort work may be a key to what the natal horoscope
itself really is (hint: it’s not you, it’s an evolving web around you, begun at birth),
and midpoints in time may
shed special light on the reoccurring hazards of regular composites
with yourself and others of certain birth years,
but that’s a
subject for another article…
For even more on
composite and synastry, see:
Soul
Mates
Composite Charts: They
Grow On You
Not
a
newsletter subscriber already? Subscribe
Free
Here!
And
every day, keep in touch with our Astrology In The News section...please
take a look! --
Breaking news from
around the globe, plus articles, reviews, it's all happening there,
changes daily..

